logo
Latest
  • No posts were found.

Follow Me
Follow Me:
Top
When to use a Cluster Graph? – Nick Hobbie
6769
post-template-default,single,single-post,postid-6769,single-format-standard,mkd-core-1.0,nickhobbietheme-child-ver-1.0,highrise-ver-1.2,,mkd-smooth-page-transitions,mkd-ajax,mkd-grid-1300,mkd-blog-installed,mkd-header-standard,mkd-sticky-header-on-scroll-up,mkd-default-mobile-header,mkd-sticky-up-mobile-header,mkd-dropdown-slide-from-bottom,mkd-dark-header,mkd-full-width-wide-menu,mkd-header-standard-in-grid-shadow-disable,mkd-search-dropdown,mkd-side-menu-slide-from-right,wpb-js-composer js-comp-ver-7.9,vc_responsive
Nick Hobbie / Design Guide  / Cluster Graph  / When to use a Cluster Graph?

When to use a Cluster Graph?

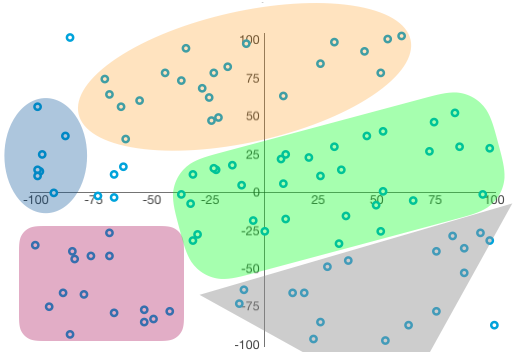
Cluster graphs are a way to understand relationships within the data. Cluster graphs are dependent on identified nodes where the nodes are the center of the clusters.  There can be multiple relationships within a single data set.

Classification

Relationship

Cluster Graphs start with showing how categories are related, similar to Scatter Graphs.

Two Variables

Cluster Graphs show the relationship between the two variables, X and Y.

Insights

Cluster Graphs take analytics to the next level, by identifying patterns within the data and ``clustering`` them together. The insights from these visuals can create data models.

Graph Types

Cluster Graphs
When the principal of common region is applied, the graphs show 5 different areas of meaning as well as some outliers. The presenter can go into more detail for each of the areas (some more significant than others).
Need More Help?